Several records were set this year so it was clearly a fast edition of the race. There were a number of factors at play, which I shall delve into (of course).
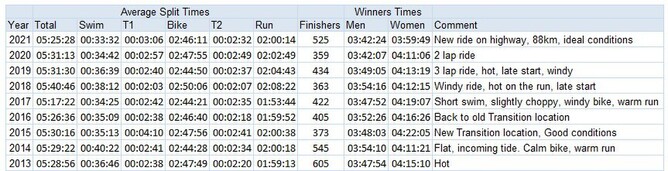
Lets start by looking at the average splits over the years:
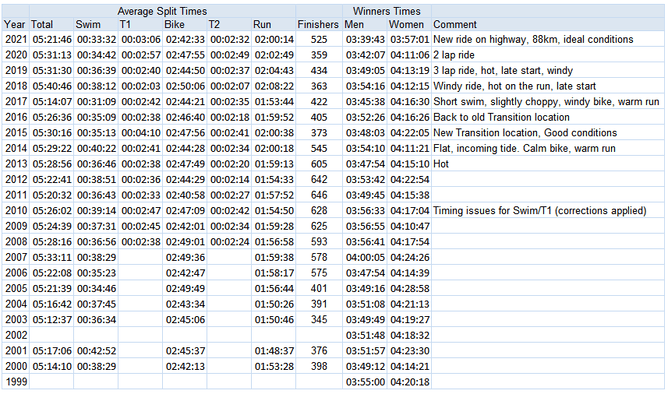
Clearly one of the faster editions in recent years, particularly on the bike.
Great to see an increase in participant numbers too.
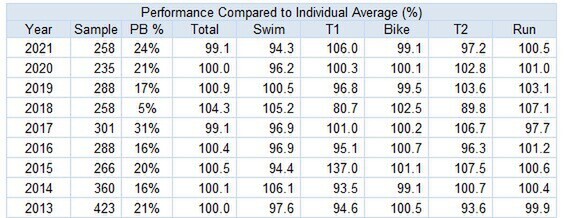
Next we'll look at the times of people who've done the race before (some time in the last 20 years):
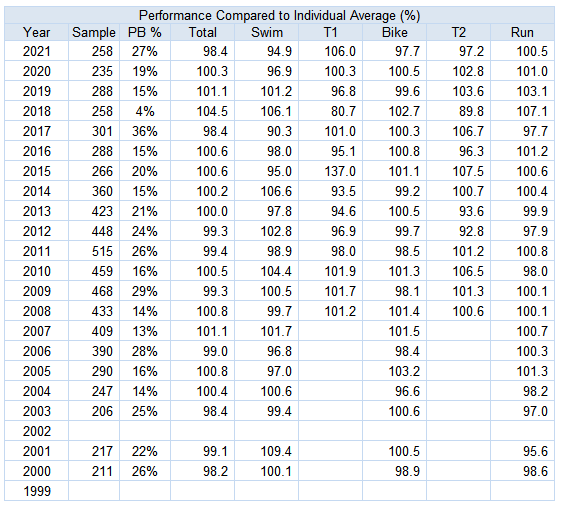
Not a particularly high repeaters score with 258 people - great for the event to be growing overall numbers by attracting new athletes.
What we see here is a really fast swim - 94.9% of average. As GPS data suggests the distance was accurate this will be mostly down to tidal effects.
A fast bike at 97.7% - this means more than a fast swim for overall times as the bike takes around 5x as long. And a slightly slower than average run.
I've added a column showing the proportion of athletes who achieved their PB in that year (excluding first timers as obviously it's their best time). If you're wondering why the column doesn't total 100% - the database covers over 5000 athletes who haven't raced every edition.
You can see that it was a fast year with 27% of athletes recording their personal best. Not quite as favourable as 2017 (short swim) but better than the last 3 years.
The CBI
I've come up with a new metric to assess the course conditions: The Cameron Brown Index
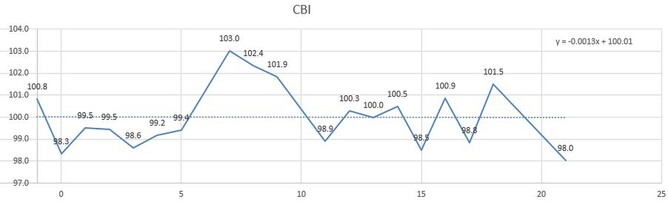
Note that this index has been corrected for distance errors in the 2017 swim and 2021 ride.
Despite this, CB recorded his best time ever for this race at 98% of his long run average. This may be the best indicator that this edition of the race was fast, given the narrow band his performances lie in.
You'll also see the equation for the linear trend line in the top right. Extrapolating out to 2030 suggests a finishing time of 3.52.59. You may say that it's impossible to forecast that far ahead and that he'll have to slow down. Current data does not support the slowing down hypothesis... ;-)
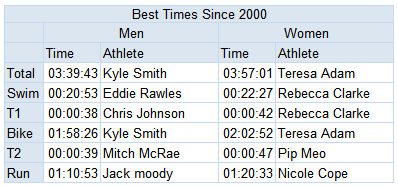
Race Records
Looking specifically at the pointiest end of the field, we saw bike and overall records for Kyle and Teresa, as well as a run record for Jack Moody.
Kyle took 3 mins off his own record from last year, while Teresa knocked 13mins off the time set by Sam Warriner in 2009.
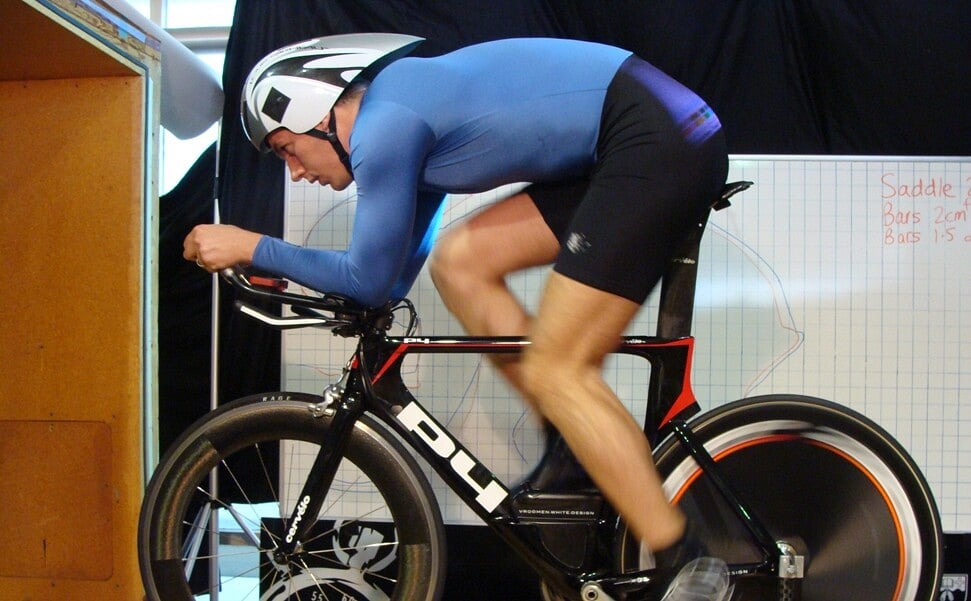
I have to say that it was a peculiar choice to start the elite men and women together given that Rebecca Clarke and Teresa in particular have historically swum times among the top men and that Teresa has ridden similar times to CB and other pro men in her last few IM races.
Distance corrected, Teresas bike time was right where my pre-race modelling indicated it should be.
Course Distance
Now to address why the course was faster. In my pre-race analysis I said this about the new bike course "Unfortunately my analysis shows that theoretically it will only be faster if it is shorter" - all the GPS files I've looked at have shown 88km (or slightly less).
If we correct the results for the short ride this year and the short swim in 2017 we get some changes to the stats:
Even corrected both 2021 and 2017 were very fast years. Which makes it particularly disappointing that I caught man flu the day before and had to pull out. I need all the help I can get these days.
An anticipated consequence of the new bike course was higher congestion, which usually leads to faster times even when riders are staying legal.
As mentioned prior to the race - the conditions were around 2mins faster than the year before, with the new course around 30s slower. This is supported by the corrected times.
The Womens record
It's worth delving a little further into the big drop in the womens record. Second place Hannah Wells was also well under the old record (even when distance corrected).
What we're seeing is a bit of catchup - the mens record has been falling in the last decade while Sams time stood strong. As a rule of thumb, the best women will be around 10% slower than the best men (largely thanks to testosterone from the research I've read) with the very best ladies getting down to an 8% deficit.
At the time Sam recorded her 4.10.47 the mens record was 3.47.54, which was nearly exactly 10% different. So the recent drop in times on the mens side that reflected increased depth in the local field hadn't been matched by the ladies.
Teresa is currently ranked 3rd on the PTO standings (behind Daniela Ryf and Lucy Charles) which take account of all long distance races. So taking the differential down to 8% fits with her previous performances.
It's tempting to look at the splits Teresa and Hannah recorded and think "imagine if they ran faster' - there isn't a huge scope for that. Run speed was traded for super fast bike splits. As the above differential stats show, they are already pushing the performance boundaries overall. Of course, we'll keep working on Teresa running faster, but not at the expense of her bike power.
As far as I've been able to find, Daniela Ryf recorded a 3.57.56 at the Gydnia 70.3 in 2018. Helle Fredricksen went 3.55.50 on the super fast Challenge Bahrain course in 2012 (with Rachel Joyce and Jodie Swallow also breaking 4hrs). Low 4 or sub 4 times are usually achieved with a good ride and great run, our girls did it the other way around.
For interest, the offroad section around the mount cost Teresa 65-70s on the run time.
Conclusion
Even with the impact of the short bike course removed, this was a fast edition of the event. Tidal, weather and course factors all played a part in delivering fast times.
While I think the highway course is good for rider safety (likewise having Doctors like Zoe Cruse who are prepared to halt their own races to help downed riders) I think the organisers will need to look at how to time the events to reduce congestion on course.