The reason we train is to improve…right?
Especially when you’ve gone to the expense of having a power meter and coach. I admit to frequent bouts of amazement at the people that I see devoting endless (I can’t say countless when we’re all using equipment to count every second/watt/stroke/stride etc) hours and thousands of dollars to their sporting pursuits without seeing meaningful improvement.
This article is about a simple way for power users to set goals and monitor whether they’ve achieved anything in their last training block
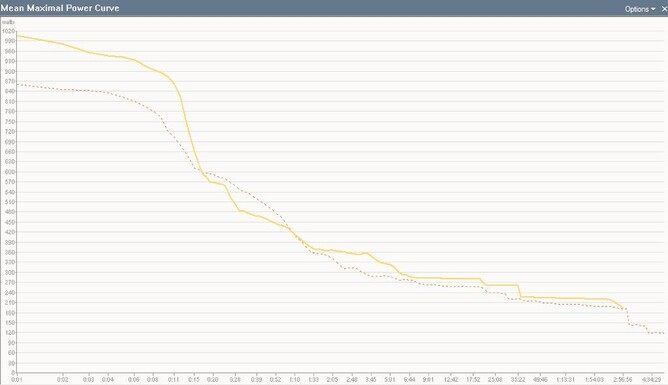
Shown above (full size here) is an Mean Maximal Power (MMP) curve – one of the standard graphing options in WKO+. Quite simply it shows your best power for all durations.
What makes it really useful is adding in a second curve to show past achievement. In the graph shown here the dashed line is the athletes power curve from prior to being coached by me. The solid yellow line is since starting to work with me.
As you can see – this athlete now has more power at every duration apart from the 20s-70s zone that we haven’t paid any attention to (but we’re going to now just for the sake of completeness…). That shows both of us that my coaching has worked.
At the end of this season the graph will be reset – so the dashed line will move up to where the solid line is now and we’ll have to work to reach a new level in the next build up. It keeps the pressure on the athlete to attain new heights and the pressure on the coach to keep adding value.
If you don’t have WKO and don’t wish to purchase it there are alternatives that will give you the same information (or ask your coach for the WKO output as they should definitely have it):
Training Peaks (the online version of WKO+) has a ‘Peak Power’ graph for paid members
You can do a similar thing with Golden Cheetah using the Critical Power Plot. As you’ll see on the linked guide it will plot the ride you’re analysing against your all time bests. Golden Cheetah is free…
The Cycleops Poweragent software does the same thing as Golden Cheetah, also free. Plus it works with any Garmin device so you don’t have to be a Powertap user.
The standard SRM software offers a chart that will show your best power achievement for each periods. Not as pretty as the MMP but allows easy comparison nonetheless I can’t tell whether Raceday offers the same functionality.
Whatever you use, this is one of the more useful and easy to understand overview metrics you can follow.
And from there it’s a slippery slope to ending up a data nerd like me…