If you have taken the time to read the ads and articles about bike equipment in the last few years you will have noticed increasing use of ‘yaw’ in the technobabble.
To help you understand what this is and what it means for your purposes here is a primer on the topic with some examples of NZ races to give perspective on what the ‘real world’ application is.
Think of Yaw as the “effective wind angle” – if you’re riding along at 30kph and there is a direct sidewind of 5kph the wind that you feel is a product of those two elements (remember vectors in school maths??) – the 5kph force at 90 degrees and the 30kph headwind (that you are creating).
I’m going to spare you an explanation of the formula and instead point those who’re interested in playing with different scenarios to the website of Hed wheels. They have a very nifty yaw calculator at the bottom of this page which looks like this:
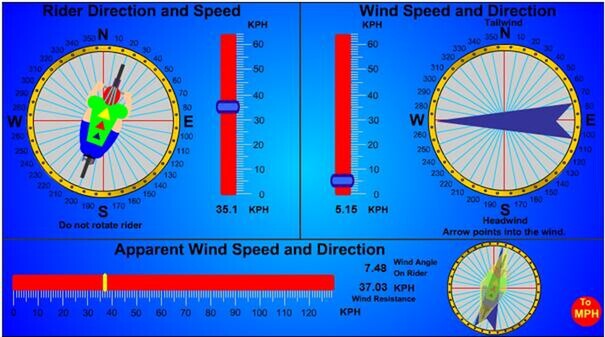
This is showing that if you’re travelling at 35.1kph with a 5.15kph crosswind you’re experiencing a ~2kph headwind effect and the rest of it as side force. In this case the yaw angle is 7.48°.
The other way of interpreting the 2kph headwind is that you would be doing 37kph in the absence of wind.
If you do have a play with that tool (all credit to Hed for making it and their app freely available) you’ll soon see that the slower the rider is going or the stronger the wind is then the higher the yaw. I should also point out that the wind speed at bike height is typically around half of the reported wind speed from the weather stations (which are a lot higher off the ground than we are) so be careful of that if you are doing calculations.
Clear as mud so far?
Let’s look at some NZ races to put a practical frame of reference around what yaw numbers are relevant to you. It’s no secret that one of my hobbies is constructing computer models of various courses – splitting the bike leg into segments of direction, gradient and length (GPS data makes this much easier than when I used to draw lines on maps). These models allow the calculation of yaw in each segment so I can generate average figures for different scenarios.
First off – Tauranga Half. A flat, fast course where most are off the bike before the wind has a chance to pick up. Using the weather conditions (from wunderground) from 2011 we get the chart shown to the right.Next we’ll look at a more complicated course – Ironman NZ in Taupo. The course has more deviations, more hills (where you go slower so the yaw is higher) and athletes are on the course until later in the day. The wind was slightly lower the previous year so the yaw figures would have been lower too.
2011 was reported as a 9.3kph wind from the North and 2010 was a 10kph wind from the Southeast.
Now that we have an appreciation for the kind of yaw numbers that we’re likely to face – what does it mean for equipment selection?
Using data from Hed again, this time their wheel testing numbers, we can draw some conclusions.
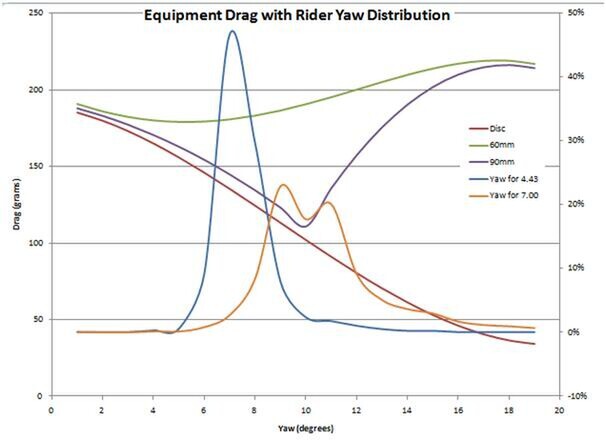
note – lines are smoothed to improve appearance, Disc data is for lenticular ‘non-bump’ version. The graph shows manufacturer provided drag curves (drag at different wind angles) for their wheels with the IMNZ yaw distributions plotted over the top. This tells us is that slower riders get more of an advantage from disc and deep wheels than fast riders.
What you can see with the orange line for the 7.00hr rider is that their yaw angles are mostly right around the sweet spot of performance for the 90mm wheel. At lower yaw all the options are closer together, so the faster rider gains less by going for the deeper options. And the disc just keeps getting better as the yaw increases (so the slower you are the better!).
Apart from this advantage of getting more out of the wheel – a slower rider is also out there for longer so they have more time to get the benefit.
What you will see with a lot of product development at the moment is the designers focussing on performance in the yaw region that most people experience – products like HED SCT, Zipps Firecrest, Treks Speed Concept, the current Hed wheels, Scott Foil road bike – they’re all aiming to be good in the 8°-20° that is relevant to the average user rather than the sub 10° that is of benefit to those who are sponsored.
If you look back at the chart for Tauranga Half you’ll see that the fastest riders are close to 4° average yaw – where all the wheel options are very close together. So while the pro racks are filled with discs and 90mm front wheels – there is little benefit (only 23s over 90km for a 2.08 rider) compared to the 60mm wheel pair.
The conclusion? Fast riders will use deep wheels and discs because they are still slightly faster. But slower riders should not be afraid to also embrace deep wheels as they actually offer greater advantages to those not at the pointiest end of the field.
The corollary to this is that if you’re getting to the pointy end and looking at where you can gain time to match the leaders – if you already have a good deep race wheel then going even deeper is not going to be the magic poppy seed.
So now when you’re looking at the speed claims for potential new equipment – look at the yaw angles that I’ve shown to be important to you to evaluate whether there is a meaningful benefit.